NEW YORK TOPS 2026 GLOBAL TOURISM CITY ATTRACTIVENESS INDEX
PR Newswire
SEOUL, South Korea, July 16, 2026
Yanolja Research Announces U.S. Cities and Asian Destinations Redefine Urban Tourism Appeal
SEOUL, South Korea, July 16, 2026 /PRNewswire/ -- Yanolja Research, a global research institute specializing in travel and tourism, today announced the 2026 results of the Yanolja Attractiveness Index, officially titled the Global Tourism City Attractiveness Index, a demand-driven ranking that measures how strongly major tourism cities capture global traveler attention and emotional appeal.
Developed jointly by Yanolja Research, Purdue University's CHRIBA Institute in the United States and Kyung Hee University's H&T Analytics Center in Seoul, the index uses global social media data across 14 languages provided by Brandwatch. The released 2026 ranking covers 200 cities and is designed to go beyond conventional supply-side tourism indicators by capturing what travelers actually talk about, remember and emotionally value.
New York Leads Overall; Paris, Osaka, Kyoto and Seoul Complete the Top Five
In the 2026 ranking, New York ranked No. 1 overall, reflecting its rare combination of global visibility and deeply favorable visitor sentiment. Paris ranked No. 2, followed by Osaka at No. 3, Kyoto at No. 4 and Seoul at No. 5. The remainder of the global top 10 includes London (No. 6), Rome (No. 7), Bangkok (No. 8), Okinawa (No. 9) and Chicago (No. 10).
The results show that global tourism appeal is no longer defined only by iconic landmarks or infrastructure scale. Leading cities increasingly succeed when they combine strong cognitive awareness with emotionally satisfying, shareable, and distinctive visitor experiences.
U.S. Cities Demonstrate Exceptional Depth Across the Global Rankings
The United States delivered the broadest upper-tier presence in the 2026 index, with 16 U.S. cities in the global top 50 and 19 in the top 100. Beyond New York's No. 1 position, Chicago ranked No. 10, Los Angeles No. 13, Miami No. 15, Washington, D.C. No. 18, Boston No. 22, Dallas No. 23, Tampa No. 24, San Francisco No. 26 and Houston No. 28.
Other U.S. cities also performed strongly, including Atlanta (No. 31), Seattle (No. 32), Las Vegas (No. 36), Orlando (No. 45), Philadelphia (No. 46), Denver (No. 50), San Diego (No. 54), Nashville (No. 65) and New Orleans (No. 78). This breadth suggests that the U.S. tourism portfolio is not dependent on a single gateway city, but is supported by a diverse ecosystem of cultural, business, entertainment, leisure and lifestyle destinations.
Asia's Rise Is Driven by High Emotional Attractiveness
Asian destinations were especially strong on affective attractiveness, the index dimension that captures positive emotion, perceived experience quality and visitor enthusiasm. Japan was the clearest example: Osaka and Kyoto ranked No. 1 and No. 2, respectively, in affective attractiveness, while Okinawa, Tokyo, Nagoya, Fukuoka and Yokohama also appeared among the leading global cities.
Korean destinations also showed meaningful global visibility. Seoul ranked No. 5 overall and No. 4 in affective attractiveness, while Busan (No. 42), Jeju (No. 44), Incheon (No. 51) and Daegu (No. 88) were also included in the global top 100. Thailand also performed strongly, with Bangkok ranked No. 8 and Chiang Mai No. 27 overall.
A New Demand-Side Lens for Measuring Tourism City Appeal
Unlike traditional tourism competitiveness measures that emphasize supply-side conditions such as airport access, hotel capacity, policy support or infrastructure, the Global Tourism City Attractiveness Index focuses on the demand side: how travelers perceive, discuss and emotionally evaluate destinations. The framework is built on two complementary pillars:
Cognitive Awareness: measures global buzz volume and destination salience — in other words, whether a city is visible, recognizable and top-of-mind in global travel conversations.
Affective Attractiveness: measures emotional responses and perceived qualitative value — in other words, whether travelers feel a destination is memorable, satisfying and worth recommending.
The model is informed by the Push-Pull Motivation Framework and Destination Image Theory, connecting travelers' internal motivations with the external attributes that make destinations appealing. The evaluation uses 419 keywords across four core dimensions: urban aesthetics and natural scenery; culture and history; experiential tourism content; and hospitality.
Strategic Value for Cities, DMOs and the Private Sector
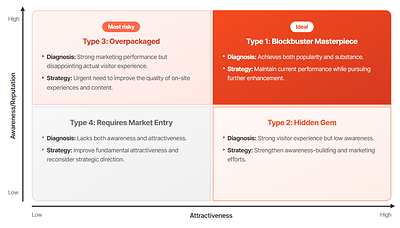
The index is designed not only as a ranking, but also as a diagnostic tool. By positioning cities according to awareness/reputation and attractiveness, the framework identifies four strategic profiles: Blockbuster Masterpieces, Hidden Gems, Overpackaged Destinations and Market Entry Required destinations. This enables destination management organizations, governments and tourism businesses to better understand whether they should prioritize brand amplification, experience-quality improvement, product development or more fundamental repositioning.
For policymakers, the index can support more precise resource allocation, city-branding evaluation, and market-specific tourism strategy. For the private sector, it can help identify high-potential destinations, emerging visitor preferences and experience gaps that may not be visible through arrivals or spending data alone.
"The 2026 index shows that the most competitive tourism cities are no longer simply the most visited or most heavily promoted places. They are cities that successfully convert global awareness into emotionally meaningful visitor experiences," said Dr. SooCheong (Shawn) Jang, Professor at Purdue University and Director of Yanolja Research. "New York's No. 1 ranking demonstrates the power of combining unmatched global recognition with strong experiential appeal. At the same time, the rise of Asian destinations such as Osaka, Kyoto, Seoul and Okinawa shows that emotional attractiveness is becoming a decisive source of tourism competitiveness." The comprehensive analysis and rankings for the top 150 cities across all regional tiers can be accessed on the official Yanolja Research website.
https://www.yanolja-research.com/brand/attractiveness/ranking/overall?lang=en
Appendix: 2026 Global Tourism City Attractiveness Index - Selected Rankings
Overall Rank | City | Country |
1 | New York | USA |
2 | Paris | France |
3 | Osaka | Japan |
4 | Kyoto | Japan |
5 | Seoul | South Korea |
6 | London | United Kingdom |
7 | Rome | Italy |
8 | Bangkok | Thailand |
9 | Okinawa | Japan |
10 | Chicago | USA |
13 | Los Angeles | USA |
15 | Miami | USA |
18 | Washington, D.C. | USA |
22 | Boston | USA |
23 | Dallas | USA |
24 | Tampa | USA |
26 | San Francisco | USA |
28 | Houston | USA |
31 | Atlanta | USA |
32 | Seattle | USA |
36 | Las Vegas | USA |
45 | Orlando | USA |
46 | Philadelphia | USA |
50 | Denver | USA |
About Yanolja Research
Yanolja Research is a global research institute focused on data-driven analysis and policy insights for the travel, tourism and hospitality industries. Through collaborations with academic and industry partners, Yanolja Research develops evidence-based frameworks to support destination strategy, tourism innovation and industry competitiveness.
 View original content to download multimedia:https://www.prnewswire.com/news-releases/new-york-tops-2026-global-tourism-city-attractiveness-index-302824413.html
SOURCE Yanolja Research

